Key Facts about Methane Emissions from Agriculture
Explore facts from the agriculture sector and discover methane emissions sources, learn about their contributions to climate change, understand how emissions evolve over time and see opportunities to drive mitigation actions.


On this page, learn about
Underlying sources of methane
Reducing methane emissions is a powerful pathway for achieving near-term warming targets
Methane’s relatively short lifespan, strong potency, and abundance, as well as its economic value when captured to produce energy, make emissions reductions from this gas a powerful pathway for achieving near-term (e.g., 2030 and 2050) warming targets.
Global methane emissions sources – Agriculture Sector
40% Global methane emissions from Agriculture (range 36-41%)
-
32% Livestock
-
29% Enteric Fermentation
-
3% Manure Management
-
-
9% Rice Cultivation
Percentages of global total
| Source | % of Global Total | Featured Stat |
|---|---|---|
| Agriculture | 40% — Global methane emissions from Agriculture (range 36-41%) | |
| Livestock | 32% | |
| Enteric Fermentation | 29% | |
| Manure Management | 3% | |
| Rice Cultivation | 9% | |
| Fossil Fuels | 34% — Global methane emissions from Fossil Fuels (range 33-35%) | |
| Oil & Gas | 18% | |
| Coal | 13% | |
| Industrial Processes | 1% | |
| Waste | 19% — Global methane emissions from Waste (range 17-21%) | |
| Wastewater | 12% | |
| Solid Waste | 10% |
EMISSIONS PROFILE BY SUB-SECTOR AND GEOGRAPHY
Where are agricultural methane emissions most prominent?
Because of the dominance of livestock in agricultural emissions, the regions and countries that lead in agricultural methane are those that have the largest livestock herds, in particular beef and dairy cattle herds. China, Brazil, India, the United States, and Pakistan have the five largest cattle herds in the world.
Top methane emissions from Agriculture in 2022
| Geography | Enteric Fermentation | Rice Cultivation | Manure Management | Total (incl. Other) | ||||
|---|---|---|---|---|---|---|---|---|
| Enteric Fermentation (Mt) | % of sector total | Rice Cultivation (Mt) | % of sector total | Manure Management (Mt) | % of sector total | Total (Mt) | % of sector total | |
| Asia | 42.5Mt | 26.3% | 33.3Mt | 20.6% | 5.6Mt | 3.4% | 81.4Mt | 50.4% |
| China | 7.2Mt | 4.4% | 13.8Mt | 8.5% | 1.4Mt | 0.9% | 22.4Mt | 13.9% |
| India | 14.3Mt | 8.8% | 4.2Mt | 2.6% | 1.2Mt | 0.8% | 19.6Mt | 12.2% |
| Pakistan | 5.6Mt | 3.5% | 0.9Mt | 0.6% | 0.4Mt | 0.3% | 7Mt | 4.3% |
| Central and South America | 29.1Mt | 18% | 0.8Mt | 0.5% | 0.9Mt | 0.6% | 30.8Mt | 19% |
| Brazil | 15.1Mt | 9.3% | 0.1Mt | 0.1% | 0.3Mt | 0.2% | 15.6Mt | 9.6% |
| Africa | 20.7Mt | 12.8% | 1.9Mt | 1.2% | 0.8Mt | 0.5% | 23.4Mt | 14.5% |
| Europe | 7.7Mt | 4.8% | 0.1Mt | 0.1% | 2.4Mt | 1.5% | 10.3Mt | 6.4% |
| North America | 7.4Mt | 4.6% | 0.2Mt | 0.1% | 2.6Mt | 1.6% | 10.2Mt | 6.3% |
| United States | 6.5Mt | 4.1% | 0.2Mt | 0.1% | 2.3Mt | 1.4% | 9.1Mt | 5.6% |
| Middle East | 1.5Mt | 0.9% | 0.1Mt | 0.1% | 0.1Mt | 0% | 1.6Mt | 1% |
| Other | 3.5Mt | 2.1% | 0Mt | 0% | 0.3Mt | 0.2% | 3.8Mt | 2.3% |
| Grand Total | 112.3Mt | 69.5% | 36.5Mt | 22.6% | 12.7Mt | 7.9% | 161.5Mt | 100% |
The dominant source of emissions in the agricultural sector is livestock (78%)
Because of the dominance of livestock in agricultural emissions, the regions and countries that lead in agricultural methane are those that have the largest livestock herds, in particular beef and dairy cattle herds. China, Brazil, India, the United States, and Pakistan have the five largest cattle herds in the world. Emissions profiles vary considerably by animal type and system.
Download materials to learn more:
Global methane emissions by animal
Intensity of global methane emissions by animal
Emissions growth has been moderated by increased productivity and yield gains.
In particular, the US and European livestock sectors have greatly improved their productivity. In the US, between 1971 and 2020, milk production doubled while herd size decreased by 30%, and GHG emissions only increased by 14%. Productivity remains very low in many parts of the world, particularly South Asia and Africa, where the emissions profile of a unit of milk is 5-6x what it is in North America.
Download materials to learn more
In the livestock sector, very few interventions which can reduce methane are currently on the market
Adopting interventions that are currently in development (e.g., other types of feed additives, genetics/breeding, methanogen vaccines) requires a degree of commercial sophistication and management that is not found in much of the world. Moreover, feec additives are not currently viable in grazing systems because additives break down rapidly in the rumen and therefore must be administered regularly (e.g., daily). Recent research has shown promise that extensive systems can use novel delivery methods that can help reduce emissions without need of confinement. This frequency of intervention is not practical in grazing systems where the cattle may be handled a little as a few times per year, hence new techniques much be designed for these systems.
e.g., forage quality for grazing animals
e.g., improved shelters, preventative hygiene and health care, responsive disease diagnosis and veterinary care
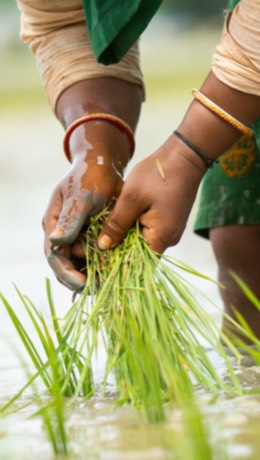
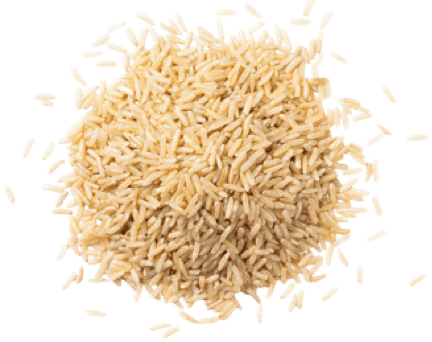
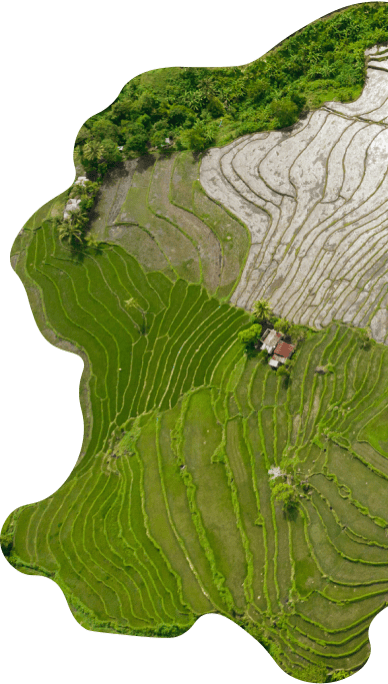
Rice is the agricultural sector with the highest potential for methane reduction as a percentage of current emissions
Emissions from rice vary on production systems, organic load, and even fertilizer use. Mitigation interventions for rice are well studied and commercially available.
However, the main intervention – alternative wetting and drying – which aims to reduce the amount of time that rice production is occurring in anaerobic conditions, is challenging to implement. It requires a high degree of water control which isn’t possible in many of the relevant systems and because effective implementation requires additional labor.